📊 Full opportunity report: The Stanford AI Index 2026 Audit: Reading the Field’s Annual Report Card With a Critic’s Pen on ThorstenMeyerAI.com — validation score, market gap, and execution plan.
TL;DR
The Stanford AI Index 2026 has been published, offering detailed data on AI research, performance, and policy. While rigorous in some areas, its interpretive claims require cautious reading due to acknowledged limitations.
The Stanford AI Index 2026 was released three weeks ago, providing a comprehensive report on AI research, performance, and policy worldwide. While it is the most-cited annual AI document, experts emphasize the importance of critically assessing its methodology and interpretive claims due to inherent limitations.
The 2026 edition spans over 400 pages across eleven chapters, covering research, technical benchmarks, economic impact, responsible AI, policy, and public opinion. It is widely regarded as the most authoritative annual snapshot of AI progress, cited by major newspapers, governments, and academic papers.
The Index employs rigorous methods for tracking benchmark performance, policy activity, and scientific publications, with transparent scoring on model capabilities and transparency indices. Notably, it reports a significant improvement in benchmark scores, with some models reaching over 50% on complex reasoning tasks, and documents increased AI policy activity across multiple jurisdictions.
However, the Index also acknowledges several limitations. Its interpretive claims—such as the economic value of AI or public sentiment—are less rigorously supported and should be treated with caution. Critics point out that the aggregation of diverse sources can introduce errors, and some areas, like workforce impact and consumer value, lack robust data. The document’s transparency assessment, though honest, reveals that industry opacity remains a concern.
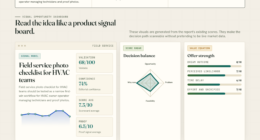
Reading the report card with a critic’s pen.
The Index is rigorous on what it counts and interpretive on what it summarizes. Both descriptions are accurate.
The Stanford AI Index 2026 is the most cited annual document on AI. 400+ pages, 9th edition, 11 chapters. The Foundation Model Transparency Index dropped 58 → 40 in one year. The Index can only measure what gets disclosed. The audit identifies where to anchor on counted facts, where to discount the interpretive claims, and how to read the document with appropriate skepticism.
Where the Index is rigorous. Where the Index is interpretive.
The Index is most rigorous on what it counts (publications, models, dollars, policies, benchmark scores). It is least rigorous on what it interprets (consumer value, workforce impact, public sentiment). Anchor on counted facts. Treat interpretive claims with proportionate skepticism.
AI research benchmarking software
As an affiliate, we earn on qualifying purchases.
As an affiliate, we earn on qualifying purchases.
Benchmarks saturate faster than they’re constructed.
The Index reports benchmarks at the moment of saturation — by which time the benchmark has lost most of its discriminating power. The benchmarks the 2026 Index reports are running out of useful signal even as they are being published. The 2027 Index will need new benchmarks the 2026 frontier doesn’t saturate.

KALI LINUX LLMs SECURITY: Develop Security Methods in AI Models with High-Performance Tools (KALI LINUX & Frameworks USA)
As an affiliate, we earn on qualifying purchases.
As an affiliate, we earn on qualifying purchases.
Five reliable. Five fragile.
Specific numbers from the 2026 Index that should be quoted directly versus quoted only with explicit confidence intervals. The same Index produces both kinds of finding. Distinguishing them is the audit’s central practical contribution.
- FMTI 58→40 YoYIndex’s own measurement of explicit construct. Documented methodology. Trend unambiguous.
- Arena Elo top tierAnthropic 1503, xAI 1495, Google 1494, OpenAI 1481. Standardized methodology. Quote directly.
- Closed-vs-open gap 3.3%Up from 0.5% in Aug 2024. Precise measurement of structural shift. Open-vs-closed inflection.
- Robots 12% household tasksMost underappreciated number in entire Index. Concrete physical-world gap.
- Apollo Go 11M rides +175% YoYPublic-record disclosure. Clean methodology. Chinese AV scale underreported.
- $172B “consumer value”Willingness-to-pay survey data. Real CI: ~$50–300B. Quote trend, not level.
- 53% global adoption in 3 yearsIncludes any-use-ever. Sustained use ~20–30%. Clarify the definition.
- Median value tripled ’25-’26Same WTP methodology. Probably 1.5–4×. Direction reliable, magnitude not.
- US ranks 24th at 28.3%Trial-vs-sustained sensitivity. Rank > absolute %.
- “Hits young workers first”Multiple alternative explanations. Treat as correlation, not causation.
The Index’s authority creates the obligation to audit it. The audit produces a more useful document, not a less useful one.

Agentic Artificial Intelligence: Harnessing AI Agents to Reinvent Business, Work and Life
As an affiliate, we earn on qualifying purchases.
As an affiliate, we earn on qualifying purchases.
Four assignments. By role.
Read the methodology appendix first.
Even if you cited prior editions, the 2026 has more rigor on some numbers and more interpretive freedom on others. Quote rigorous numbers directly. Caveat interpretive numbers. Acknowledge the Index’s own self-criticism in your citation. Stanford HAI’s authority comes partly from its self-criticism — preserving that in citation chains preserves the authority.
Use the FMTI drop as institutional pressure.
The 58 → 40 transparency drop is the field’s primary authoritative scoreboard saying you disclose less than you used to. Visibility in the Index — and the framing capture that comes with it — depends on willingness to disclose. Labs that publish more methodology capture more positive framing. Labs that publish less become invisible to the document that policymakers read.
Calibrate use to category gradations.
Policy chapter is most rigorous and most directly actionable. Public-opinion chapter most subject to framing effects. FMTI is the single most important methodological signal. Do not quote consumer-value dollar figure as a fact; quote the trend instead. Read policy + transparency carefully. Read public-opinion with skepticism.
Use the Index as starting point, not citation chain endpoint.
Read the methodology appendix before any chapter. The science and medicine chapter framings are unusually critical and worth integrating into your own work. Treat “notable models” geographic distribution as curated rather than complete picture. Underlying source surveys and labor-market studies are the real citation chain.

AI Governance: Building AI with Responsibility | human centric ai governance | enterprise ai ethics solutions | ai accountability and policy guide | future ready ai governance toolkit | Governance AI
As an affiliate, we earn on qualifying purchases.
As an affiliate, we earn on qualifying purchases.
Implications of the Index’s Methodology and Findings
This report shapes AI policy, investment, and research priorities globally. Its rigorous benchmark data influences government regulations and corporate strategies. However, the acknowledged methodological limits mean that stakeholders should interpret interpretive claims—such as economic impact and societal effects—with caution. The Index’s transparency efforts push industry toward greater openness, but gaps remain, especially regarding the most advanced models’ capabilities and real-world applications. Overall, the Index’s authority underscores the need for critical engagement to avoid overestimating AI progress based solely on aggregated metrics.Background and Evolution of the Stanford AI Index
The Stanford AI Index has been published annually since 2018, aiming to provide a comprehensive, data-driven overview of AI progress. Its ninth edition in 2026 consolidates data from multiple sources, including benchmark scores, scientific publications, policy activity, and public surveys.
Previous editions have influenced policy debates and investment trends, with increasing emphasis on transparency and cross-jurisdictional analysis. The 2026 report builds on this legacy but also faces criticism for potential overreliance on certain metrics and the challenge of interpreting complex, often incomplete data sources.
Recent developments include a surge in benchmark scores, particularly in language and reasoning tasks, and a broader policy landscape with more countries enacting AI regulations. Nonetheless, the field remains opaque in some areas, notably the capabilities of the most advanced models, which are often proprietary and undisclosed.
“The Index provides invaluable data but must be read with an understanding of its methodological limits, especially in interpretive areas like economic impact and societal influence.”
— Thorsten Meyer, AI researcher
Remaining Uncertainties in the Index’s Data and Interpretation
While benchmark scores and policy counts are well-supported, the Index’s interpretive claims—such as economic value, workforce displacement, and public sentiment—are less certain. The aggregation of diverse sources can introduce errors or biases, and the most advanced AI capabilities remain difficult to measure accurately due to proprietary restrictions and lack of disclosure.
It is also unclear how well the Index captures rapid technological shifts or the qualitative aspects of AI deployment in real-world settings. The ongoing evolution of AI models and policies means some data may become outdated quickly, and interpretive claims require cautious consideration.
Next Steps for AI Monitoring and Policy Development
Stakeholders should continue to scrutinize the Index’s methodology, especially its interpretive claims. Future editions may incorporate more granular data on model capabilities and societal impacts, possibly through new transparency initiatives.
Policymakers and industry leaders are likely to use the Index as a reference point but should supplement it with targeted, context-specific assessments. Continued efforts to improve transparency and data collection will be critical to refining understanding of AI’s trajectory and societal effects.
Key Questions
How reliable are the benchmark performance scores in the Index?
The benchmark scores are considered highly reliable as they are based on standardized tests with traceable sources. However, they do not fully capture real-world AI capabilities or deployment nuances.
What are the main limitations of the Index’s interpretive claims?
Interpretive claims about economic impact, workforce displacement, and societal effects are less rigorously supported and should be approached with caution. These areas rely on aggregated surveys and estimates that can be biased or incomplete.
Does the Index include the latest proprietary models?
Most advanced models remain proprietary and are not fully disclosed, limiting the Index’s ability to assess their capabilities directly. This opacity affects the accuracy of some performance and impact assessments.
How does the Index influence AI policy and investment?
The Index’s data and rankings inform policymakers and investors by highlighting progress and gaps in AI capabilities, but its interpretive limits mean decisions should incorporate additional context and analysis.
What should readers keep in mind when using the Index?
Readers should focus on the well-supported data points, like benchmark results and policy counts, while treating interpretive claims with skepticism and consulting the methodology appendix for context.
Source: ThorstenMeyerAI.com